UEFA Euro 2020 Forecast Review
Congratulations to Italy for beating England and hoisting the Henri Delaunay Trophy! Now that the tournament has reached its dramatic conclusion, we can now start analyzing how our model performed.
Calibration Crash Course
Brier Scores
To check the calibration of our model, we have a couple of tools at our disposal. First is the Brier Score (BS), which is basically a way to quantify how accurate a forecast was. The equation to calculate it is:
A Brier score of 0 means that the forecast was perfectly correct; it forecasted a 100% chance for every result that happened and an 0% chance for every result that didn’t. Conversely, a Brier score of 1 would indicate the forecast was perfectly incorrect; it forecasted a 100% chance for every result that didn’t happen and a 0% chance for every result that did.
The Brier Score can be further modified to create the Brier Skill Score, which is a way to compare a forecast’s Brier Score to an “unskilled” forecast. For this analysis, that unskilled forecast gives all the possible outcomes (win/loss/draw or win/loss for knockout games) an equal chance of occuring. A Brier Skill Score of 1 indicates a forecast that was 100% better than an unskilled forecast, while a negative value indicates the forecast as a certain percentage worse than an unskilled forecast.
Calibration Plots
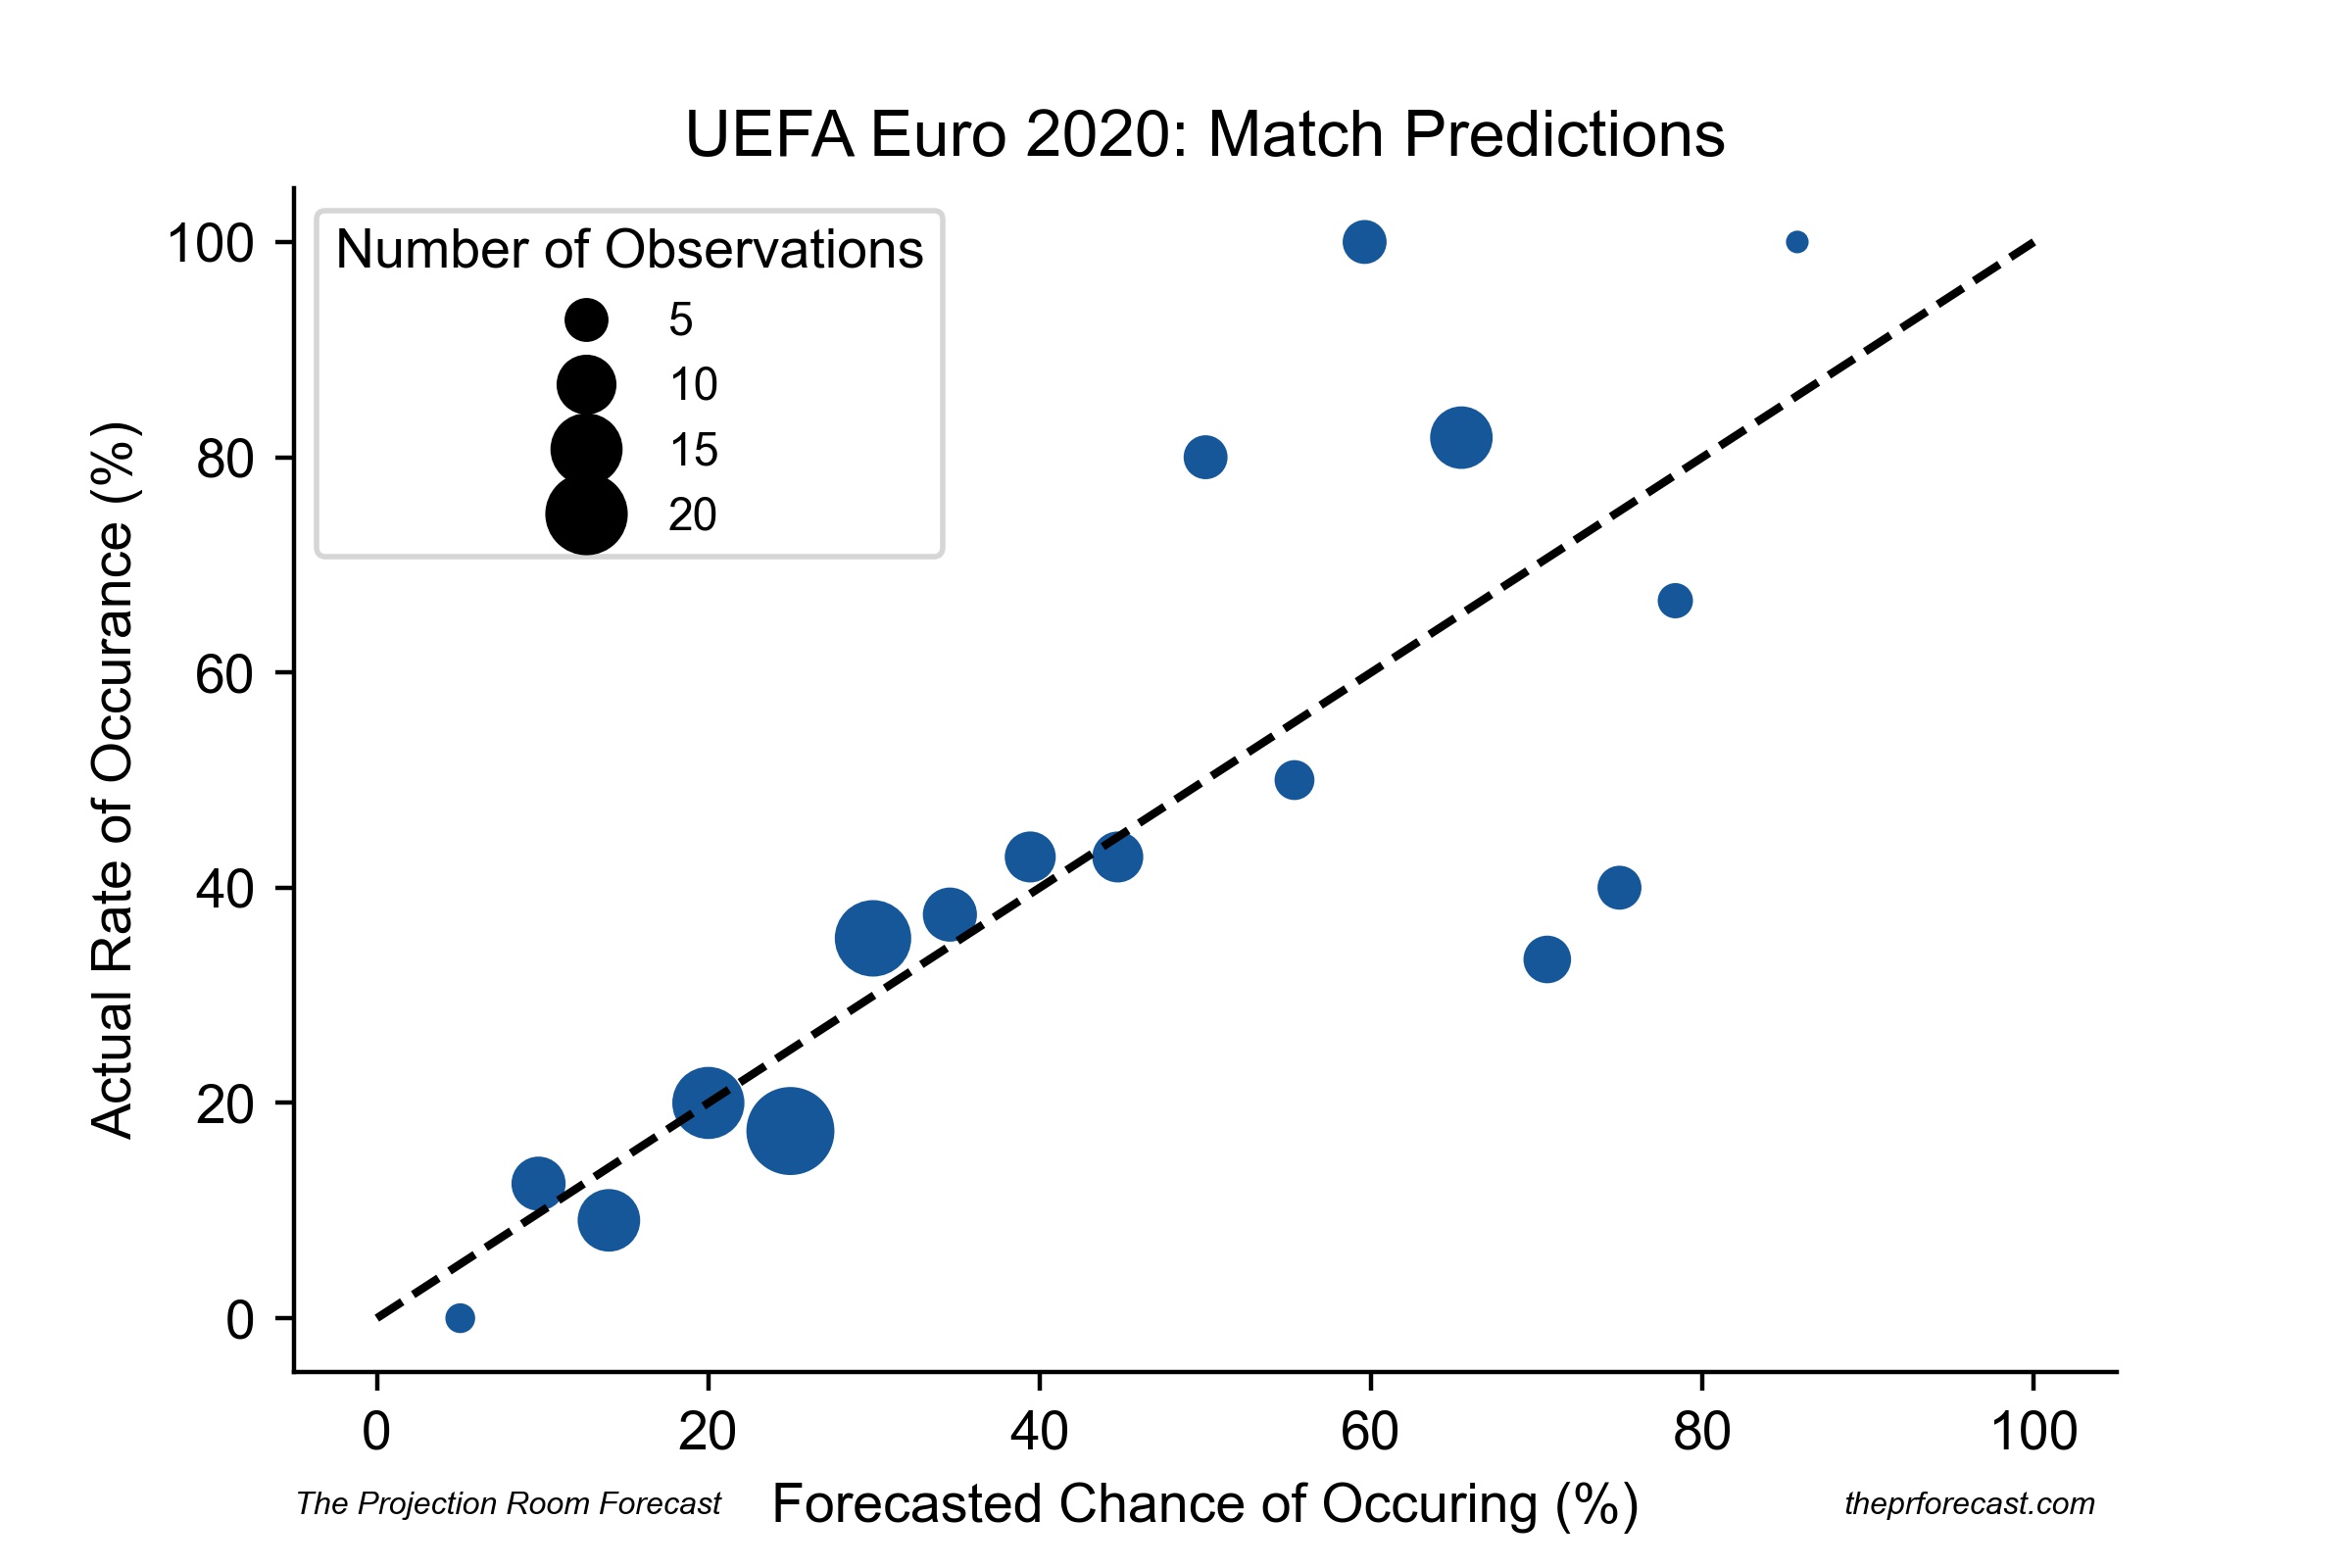
Another way to check calibration is by using calibration plots, which directly compare the foreasted chance of an event occurring to the actual rate that it occurred. In the calibration plots below, each bubble (a.k.a. bin) represents a certain number of results. The horizontal axis represents the average forecasted probability for a group of events where each bin is centered around multiples of 5% and includes probabilities 2.5% greater or less than its center (i.e. the 60% bin includes probabilities from 57.5% to 62.5%). The vertical axis represents the actual result rate, or how many times the prediction result happened vs how many times it was forecasted.
A perfectly calibrated forecast will have all its bins occupy the 45° line (shown in the plots below as a black dotted line).
Match Review
The chances we gave both teams to win, lose or draw a match.
Biggest surprise: On June 12th, 2021, we gave Finland an 11% chance of winning against Denmark. They did.
Brier Score: 0.5217
Brier Skill Score: 0.1554
Matches Correct (All): 31/51 (60.8%)
Matches Correct (Only Win/Loss): 31/43 (72.1%)
The calibration is decent at the lower ends, but strays at the higher bins. Some of this is unavoidable, for example the 85% (really 85.72%) bin only had 1 occurrence, meaning it could either be 100% or 0% This issue can be smoothed out more by increasing the bin size to 10% and the widths to 5%
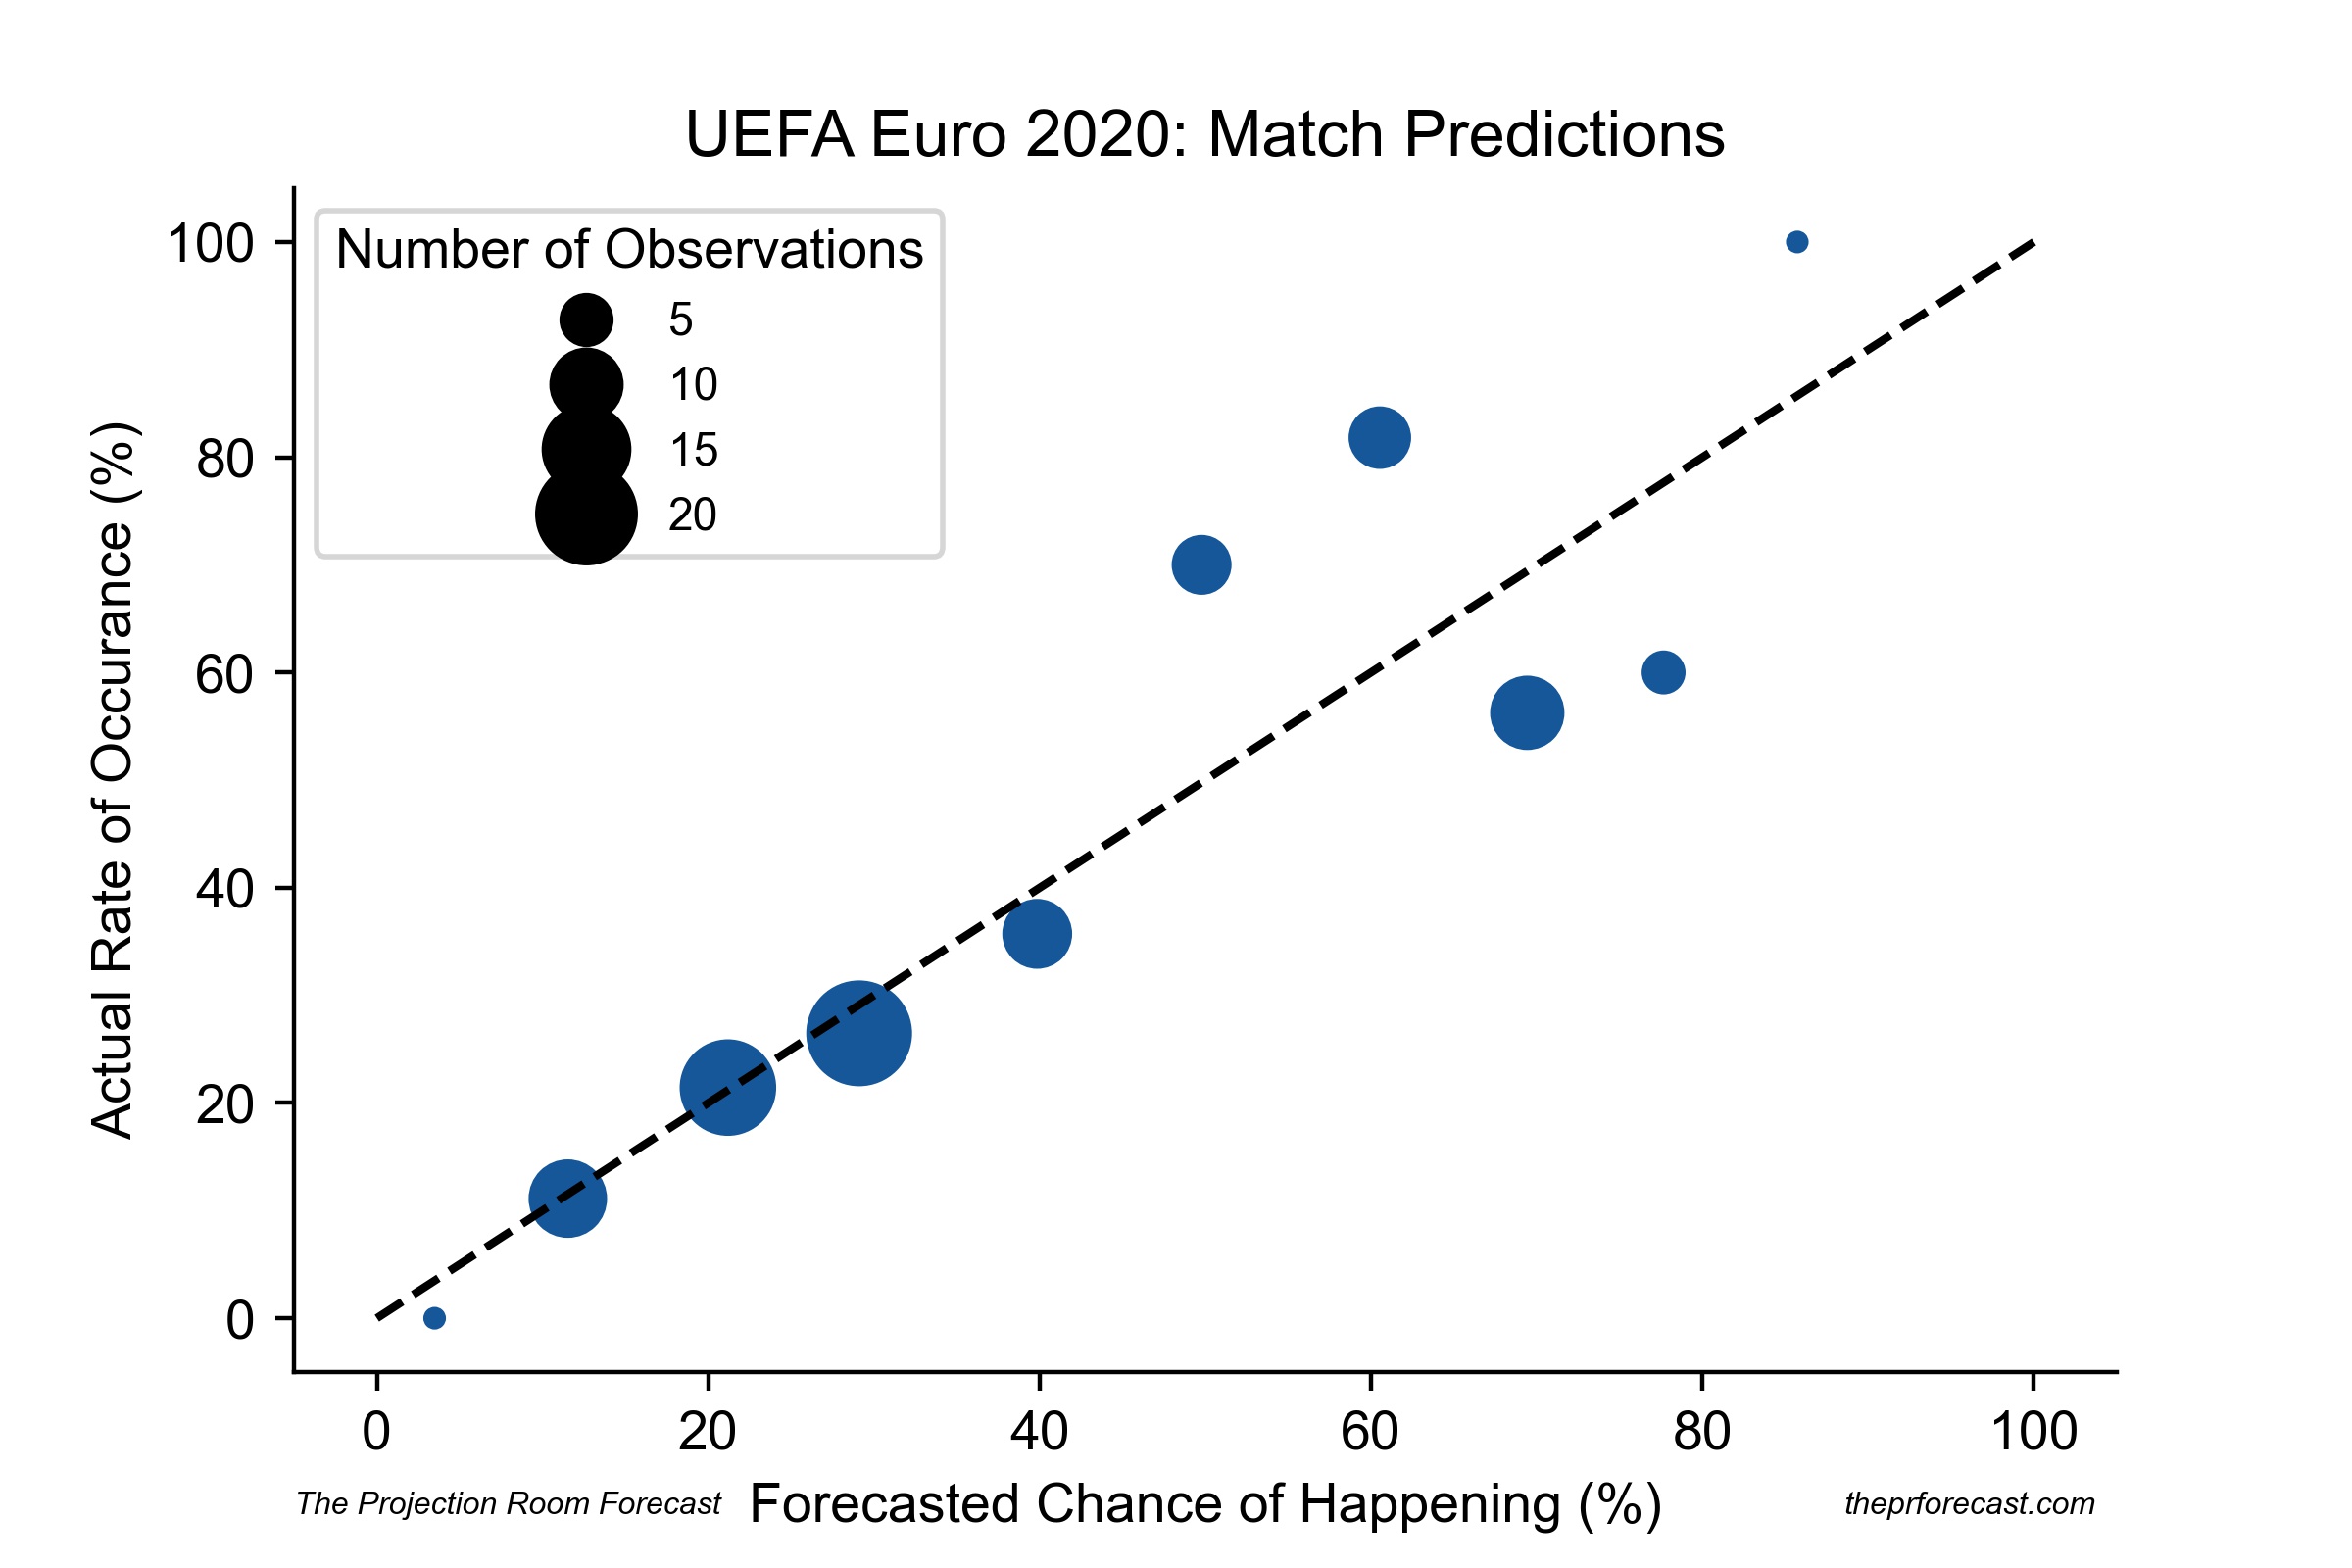
We can more clearly see the calibration with the lower chances, but also how the 50% - 60% event chances were underestimated while the 70%-80% chances were overestimated.Regardless, the Brier Score and the Brier Skill scores show that this part of the forecast was accurate, and useful, with it being almost 16% better than an uneducated forecast.
Tournament Stage Progression Review
The chance that we gave teams to finish at a certain place in their group, make each stage of the tournament, and winning Euro 2020.
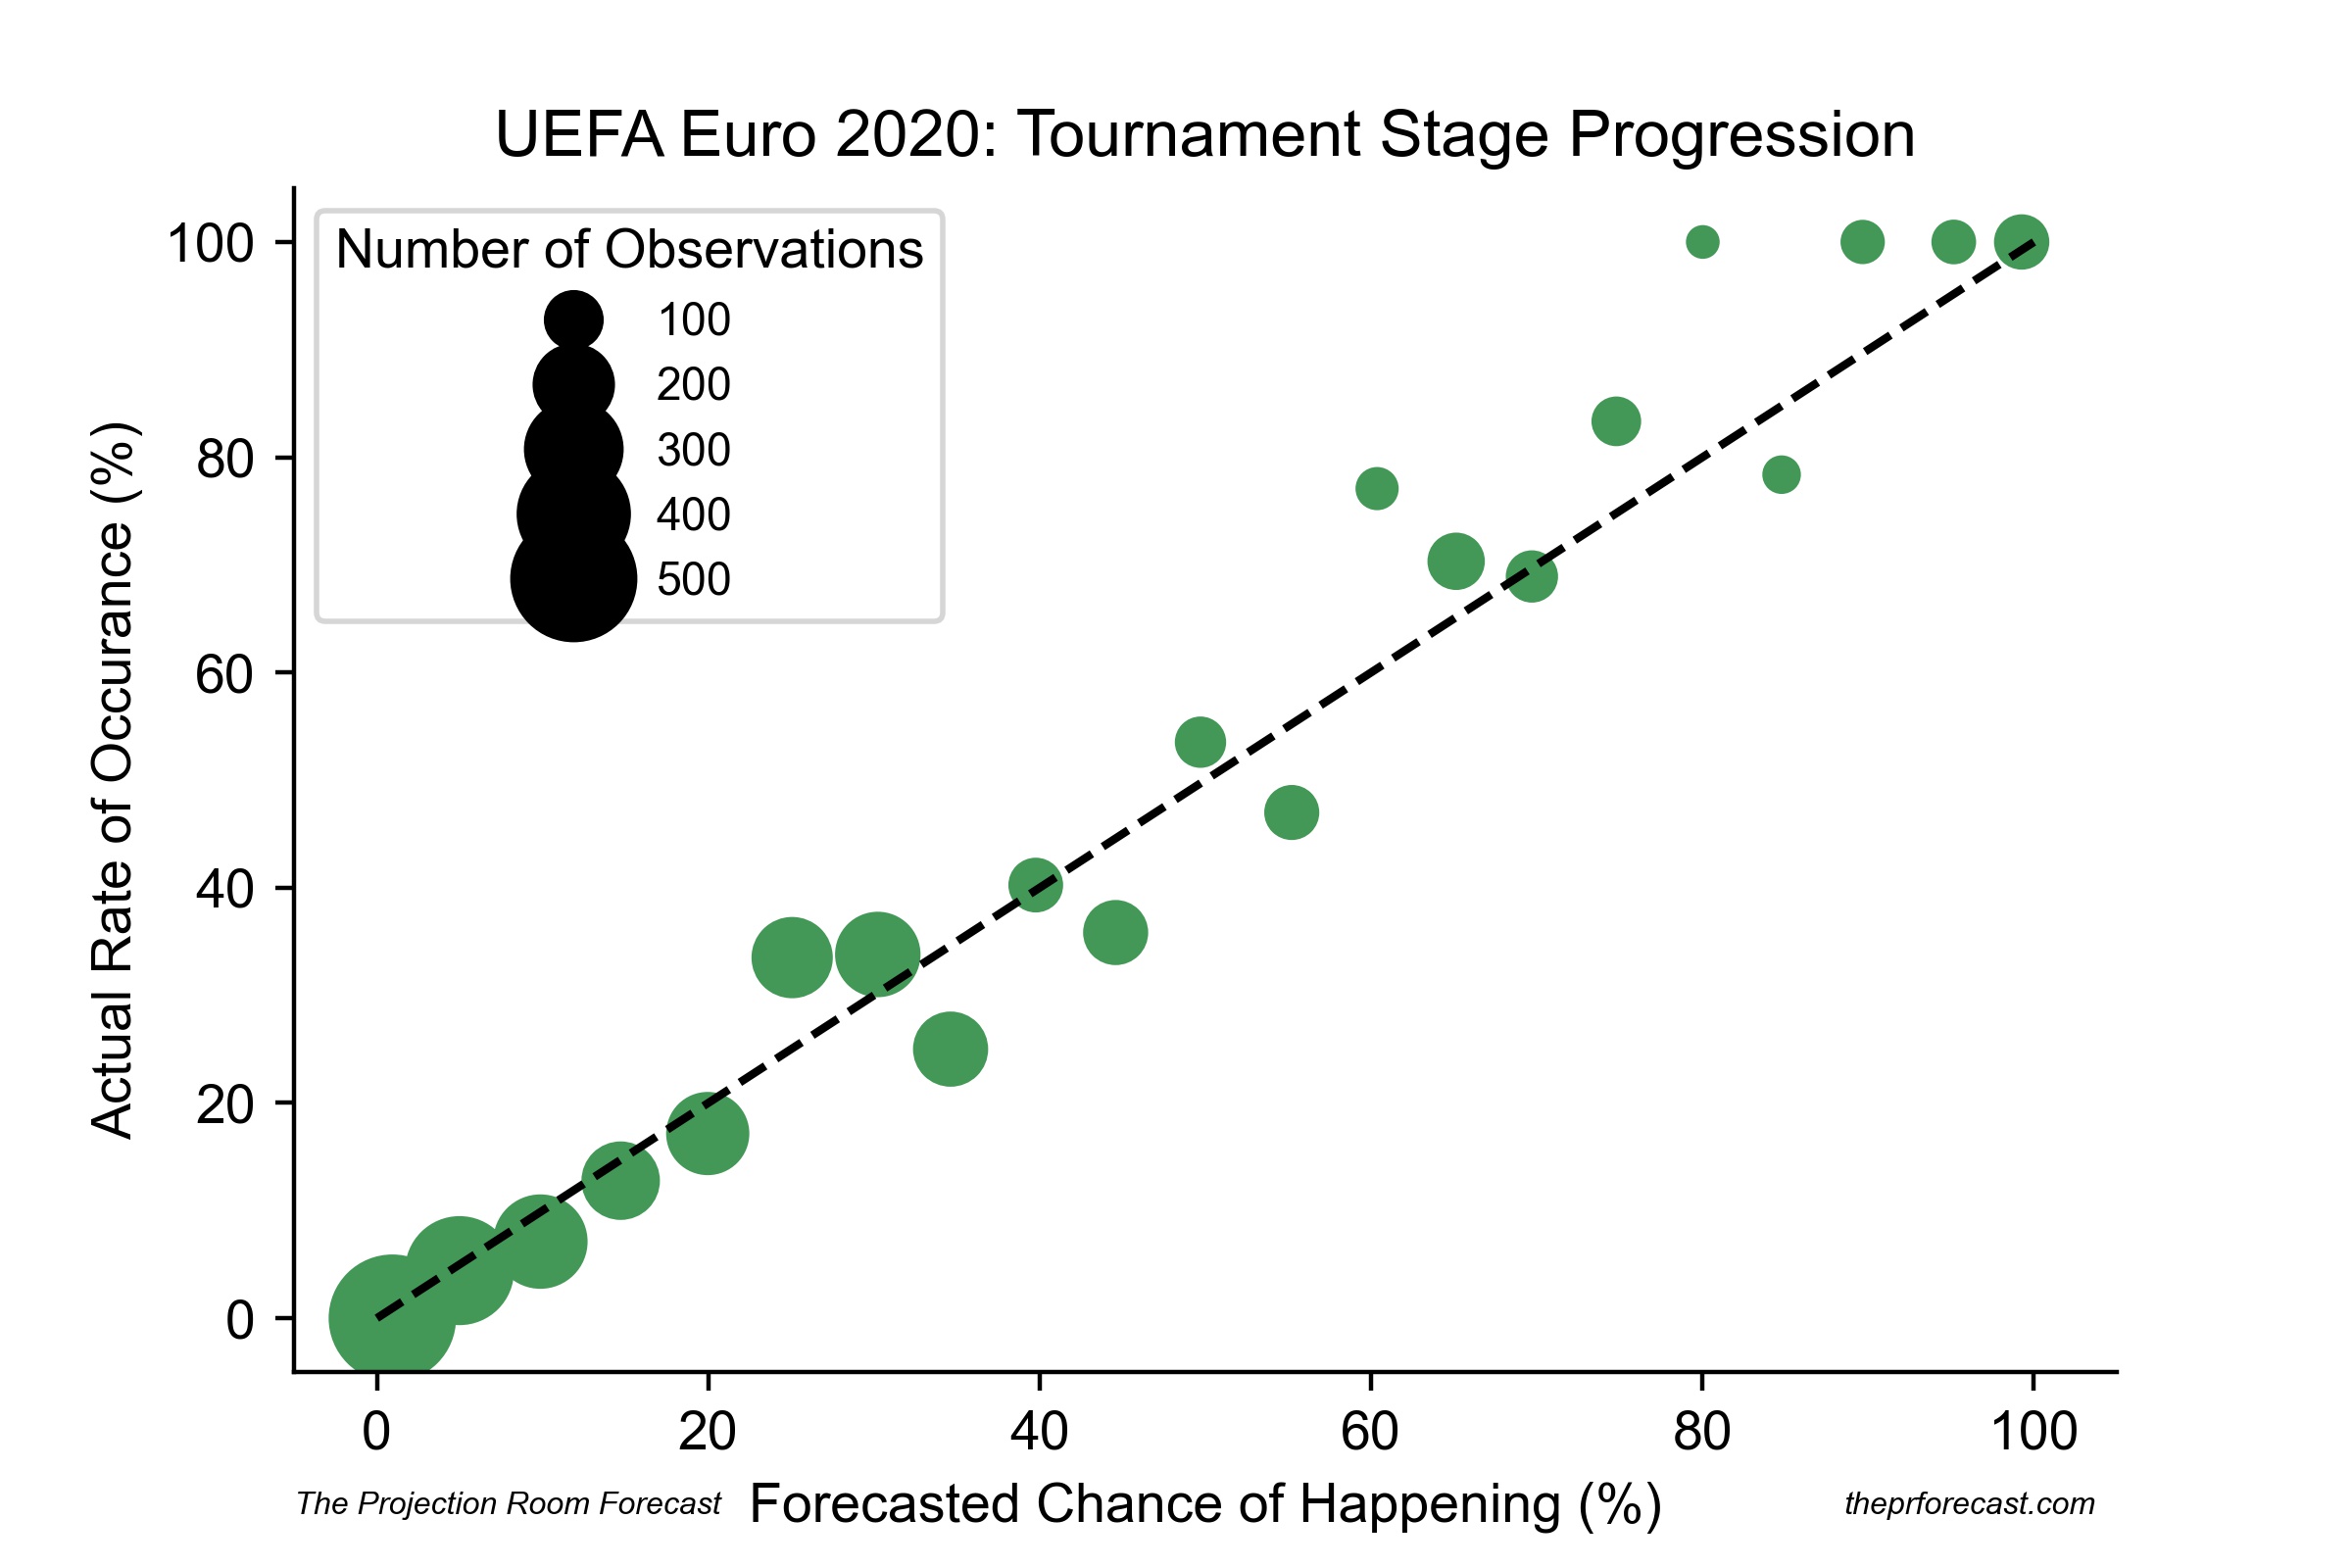
Keep in mind that for this review, we ignore situations where the outcome was already guaranteed (e.g. if a team was already disqualified, we do not include their chances of making a further round).
Biggest surprise: Before the tournament, we gave Italy a 4% chance of winning it all. They did.
Brier Score: 0.1201
Brier Skill Score: 0.5164
As can be seen, this part of the forecast was much more calibrated, and since it has more events to analyze, it does not suffer from the same outlier effect as the previous one. Normally, advancement chances are easier to quantify than match chances, since there are more ways to capture any uncertainty than with an individual match. Nonetheless, our forecast was almost 52% better than an uneducated one.
Thoughts
Overall, our model performed better than an uneducated guess would, which is impressive considering the fact that men’s international soccer tournaments are notoriously difficult to forecast due to their competitiveness. For example, FiveThirtyEight’s 2018 FIFA World Cup forecast model had a Brier Skill Score of 0.1798 (when calculated using the same unskilled forecast that we did), meaning our model’s performance is not too far off from where the pros are. But most important is the fact that our odds are pretty well calibrated, if we gave an event a 30% chance of happening, it happened ~30% of the time.
That being said, we still see areas for improvement.
Problems
During the course of the tournament, “good” teams, or at least teams we thought were good on paper, significantly underperformed expectations. When this underperformance manifested itself in matches, the model was slow to react appropriately, if it even at all. This seems to be based on a couple of reasons:
1) The matches used in the Poisson based Elo regressions went back to 2014, meaning teams that played a lot of them had their newer ones “diluted” by their prior performances. This can make it difficult to adjust for poor performances, and make the model think the team that it is forecasting now is basically the same as its old self. This is perhaps why the model undervalued Italy so much, as it included their 2016-2018 slump where they did not qualify for the World Cup and couldn’t take into account their rather stellar performances in the tournament. On the other hand, teams like France and Belgium may have been overvalued, and their shaky performances were not considered enough when they happened.
2) Elo ratings are a relatively simple way to quantify team strength, but suffer from a fatal flaw: they always increase when a team wins and always decrease when a team loses. For draws, unless the win expectancy is very close to 100%, the points exchanged are rather small. This means that unless a good team gets beaten handily by a lesser opponent, their apparent strength can appear to be unchanged
3) The way we handled knockout stage simulation tiebreakers wasn’t terrible, but assuming that scoring rates remain constant over the entirety of a match, including extra time is a bit improper. Plus, the method utilized to simulate shootouts could be more accurate.
Solutions
1) Instead of using going back to 2014 for the regressions, we should employ a rolling selection of the last x number of matches for a squad. This way, worse performances can have a much greater impact on the regressions of a team. We also will weight the matches by significance, so that games such as qualifiers and regional tournaments will have more influence than friendlies since those may feature more experimental or weaker lineups.
2) To account for model forecast to Elo rating discrepancy, we are testing out a new feature that compares how the model thought a team would perform vs how it actually performed and use that in future forecasts to make predictions. To avoid significant outliers, this would be a rolling average of the calculations from a previous number of matches.
3) More research can be done to observe how scoring rates change in extra time, which may in turn lead to more situations where the model is forced to simulate shootouts. For those shootouts, we should look at the win rate as a function of the difference in Elo ratings and use that to simulate scoring rates
The data that our model produced can be downloaded here. Feel free to take a look if you would like to relive the journey or check our work!
In the meantime, we will continue to update our MLS forecast for the remainder of the season. Thanks to all who joined us, and congratulations once again to Italy on their fantastic win!
We hope to see you all again soon!
Other Stuff
UEFA Euro 2020 Scores courtesy SportsReference.com.
Elo ratings from the World Football Elo Ratings.
Follow us on Twitter: @theprforecast
Check out our other forecasts.
Page built by @zecellomaster.
Found any errors? Want to make a suggestion? Have any comments? Email us: theprojectionroomdata@gmail.com